Working with Reports
Besides opening a report from a dashboard, users can view and run reports from the Library link and the View > Repository link from the XRA menu bar. Administrators can also click the View Reports icon on the XRA Administrator's Home page to open the Library page with the reports filter automatically applied.
There are two types of reports:
- Detail reports organized by a chart or graph's title.
- To view these reports, click View Detail on a graph or chart's pane.
- Work-item-linked reports for a specific metric.
- To view these drill-down reports, click a metric's numeric link (active if the number is 2500 or lower) on the By ... charts for the Today's Inventory Activity Dashboard, Resolved Work Item Dashboard, and Created Work Items Dashboard. Also, the Created and Resolved headings on the Summary pane of Today's Inventory Activity Dashboard have numeric work item links. See Viewing Work Items.
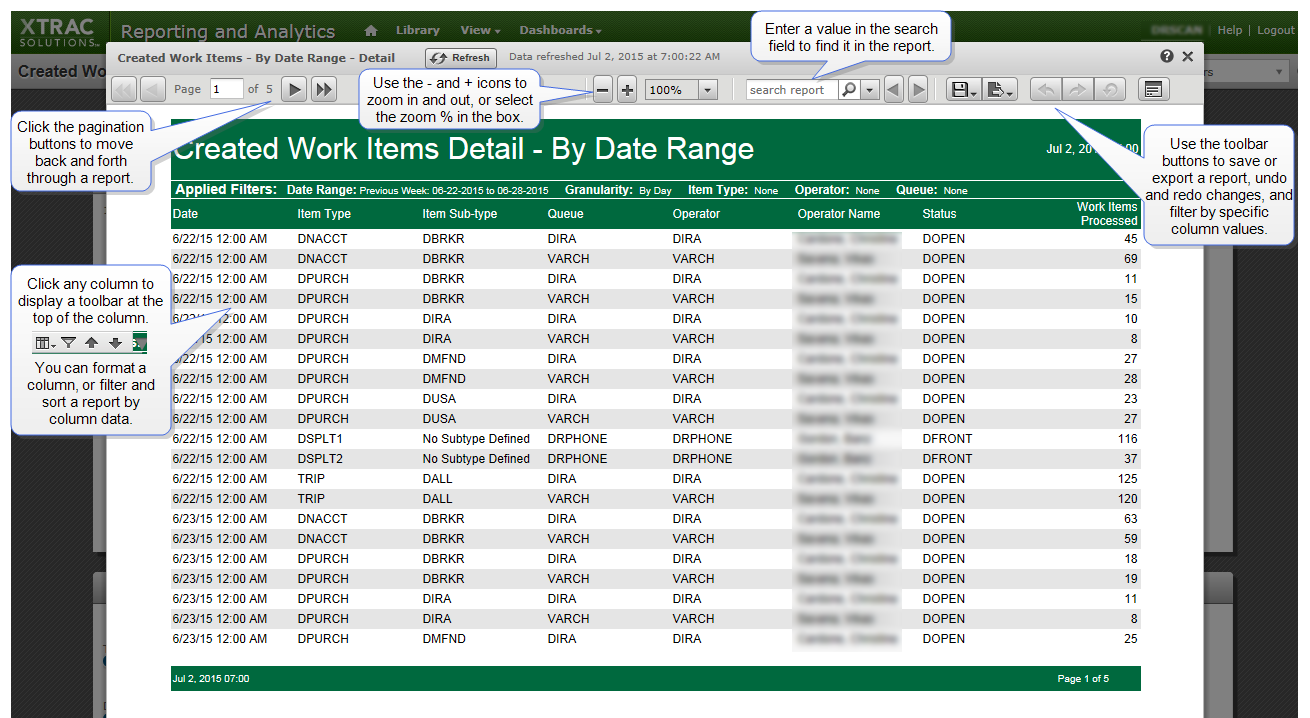
When you view and run a report, it appears in the Report Viewer. You can do the following in the Report Viewer:
Example of a Detail report
Searching Reports in the Viewer
Use the search field above the report to highlight a search term in the report.
|
1.
|
Enter a value in the search field. |
|
2.
|
Click the magnifier icon. The search term is highlighted in the report. |
|
3.
|
On the right of the search field, click the Search Next or the Search Previous arrow icons to find other instances of the term in the report. |
Scrolling through a Report
To scroll through a report's pages in the Report Viewer, click the pagination buttons on the top left of the window.
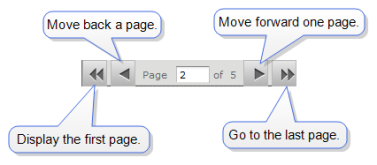
You can click the arrowhead buttons to move forward or backward a page, or to move to the start and end of a report.
Viewing Work Items
To view a metric's linked work items in a report, do the following:
|
1.
|
Click a linked numeric total on one of the following:- By ... charts on the Today's Inventory Activity, Resolved Work Items, and Created Work Items dashboards
- Created and Resolved headings on the Today's Inventory Activity dashboard's Summary pane
|
|
2.
|
When the report appears in the Report Viewer, click a linked work item number in the work item column to view the work item in XTRAC Workbench. |
Logout for external users who have opened XTRAC Workbench (XWB) tabs—When you click a work item link in a report, a new XWB tab appears for each work item you open. However, if you log out by clicking Logout on an XWB tab, you will be logged out of XRA as well. To log out of XWB and remain logged on to XRA, close the XWB tab without clicking its Logout button.
Formatting Report Columns
You can change the basic format of a report's column headings and fields, making it easy to focus on specific report data. Also, you can apply conditional formatting that lets you filter column rows based on conditional statements.
Click any of the columns to display a small toolbar for formatting, filtering, and sorting report data.

You can also click and drag the column-resize button  to widen or narrow a column.
Standard Formatting of Report Columns
To format columns using the Basic Formatting tab
|
1.
|
Run a report to open it in the report viewer. |
|
2.
|
Click the relevant column header or field to display its toolbar. |
|
3.
|
Move your pointer over the Column options button  on the toolbar, and then click Formatting.... on the toolbar, and then click Formatting.... |
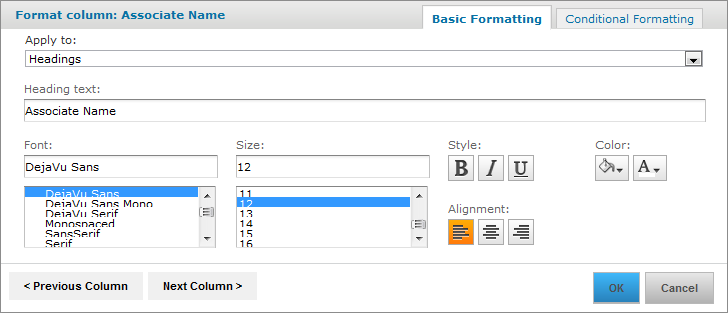
The Format column dialog box appears.
|
4.
|
On the default Basic Formatting tab, you can edit the following options: |
- Apply to: Select which element of the column to apply the formatting to.
- Heading text: You can type new heading text for the column here.
- Font: Select a new font in the list box.
- Size: Select a different font size in the list box.
- Style: To apply a font style to the text, click the Bold, Italic, or Underline text icons.
- Color: Click to open the background color picker, and then select the background color. Click to open the font-color picker, and then select the text color.
- Alignment: To align the text, click the Left, Center, or Right alignment buttons.
|
5.
|
Click < Previous Column or Next Column > to change the formatting of adjacent columns. |
To learn how to save formatted reports, go to step 13 in Saving a Report.
Conditional Formatting of Report Columns
To format columns using the Conditional Formatting tab
|
1.
|
Run a report to open it in the report viewer. |
|
2.
|
Click the relevant column header or field to display its toolbar. |
|
3.
|
Move your pointer over the Column options button on the toolbar, and then click Formatting.... |
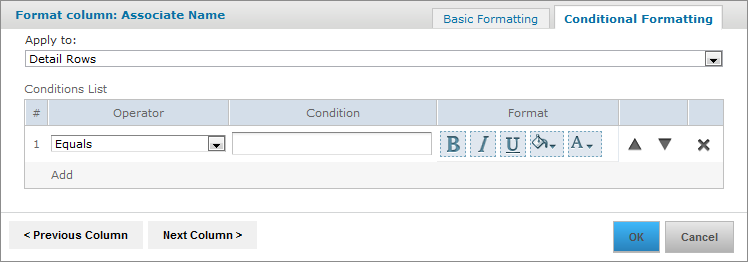
The Format column dialog box appears.
|
4.
|
Click the Conditional Formatting tab. |
|
5.
|
In the Apply to field, select the column element you want to apply conditional formatting to. |
|
6.
|
To add conditions to the selected column, click Add in the Conditions List. |
A line appears in the Conditions List section, with list fields and buttons to apply conditions.
|
7.
|
Enter the following details in the row: |
- Operator: Use the list box to select one of the following operators that define how a condition is compared to the column data.
- Equals
- Is not equal to
- Contains
- Does not contain
- Starts with
- Does not start with
- Ends with
- Does not end with
- Condition: Enter a value for the condition.
- Format: Click a format button (bold, italics, underline, background color, font color) to apply that formatting style to the display of the column with this condition.
|
8.
|
If you want to add more conditions to the column, click Add again and repeat the previous step. |
Note: Conditions higher up the hierarchy may conflict with lower-level ones. To prevent condition conflicts, use the up and down arrow buttons  to reorder the ranking of conditions.
|
9.
|
If required, click the Previous Column or Next Column buttons to add or change conditions on adjacent columns. |
|
10.
|
Click OK to apply the condition and close the dialog box. |
To learn how to save conditional formatting in reports, go to step 13 in Saving a Report.
Filtering and Sorting by Report Columns
You can use the column toolbar to filter and sort a report by the selected column.
Filtering Reports by Column Values
To filter by a column
|
1.
|
Run a report to open it in the report viewer. |
|
2.
|
Click the relevant column header or field to display its toolbar. |
|
3.
|
Click the Column filters button  on the toolbar. on the toolbar. |
The Filter column dialog box appears with the default Show all rows option selected.
|
4.
|
Select the Show only rows where option. |
The operator list box below the option becomes active.
|
5.
|
Use the list box to select one of the operators. |
|
6.
|
Enter a filter value in the field beside the list box. |
The report reloads with the column filter applied.
Before you decide to save or export the report, you can undo any changes by clicking the Undo or Undo all buttons in the top-right corner. To restore the edit, click Redo.
To learn how to save filtered columns in reports, go to step 13 in Saving a Report.
Sorting Reports
To sort columns in ascending or descending order
|
1.
|
Run a report to open it in the report viewer. |
|
2.
|
Click the relevant column header or field to display its toolbar. |
|
3.
|
Click the Sort ascending or Sort descending buttons on the toolbar. |
The report reloads with its data sorted by the selected column in the chosen order.
Note: An up or down arrow icon in the column header indicates whether the report data appears in ascending or descending order, respectively.
To learn how to save sorted reports, go to step 13 in Saving a Report.
Hiding Columns
To fine-tune your report, you can display only the columns that are relevant to your analysis by hiding specific columns.
To hide a column
|
1.
|
Run a report to open it in the report viewer. |
|
2.
|
Click the relevant column header or field to display its toolbar. |
|
3.
|
Move your pointer over the Column options button on the toolbar, and then click Hide column. |
The column disappears. Before you decide to export the report, you can undo any changes by clicking the Undo or Undo all buttons in the top-right corner. To restore the edit, click Redo.
To learn how to save reports with formatting changes, go to step 13 in Saving a Report.
Saving a Report
After you edit a report, you can save various versions of it with different format options and filters (input controls) applied. This means you can interpret the report's data by viewing it with different layouts, time periods, item types, etc. For easy access, you can store all these versions in the default Saved Reports folder in the repository.
To save a report
|
1.
|
Run a report to open it in the report viewer. |
|
2.
|
Move your pointer over the Save button  on the report's toolbar, and then click the Save As option. on the report's toolbar, and then click the Save As option. |
|
3.
|
In the Save As dialog box, enter a unique name and an optional description in the Name and Description fields. |
Note: To avoid overwriting a report with the same name, save your updated reports with a different name than the default name.
|
4.
|
Below the Description box, select the folder to save the report in. The default location is Saved Reports. |
|
5.
|
Click Save to create a copy of the report. |
|
6.
|
On the XRA menu bar, click View > Repository. |
|
7.
|
In the Saved Reports folder, click the saved report to run it and display its data in the report viewer |
|
9.
|
Click the Save button to save the formatting changes. |
|
10.
|
Click the Options button  on the report toolbar. The Input Controls dialog box appears. on the report toolbar. The Input Controls dialog box appears. |
|
12.
|
Click OK or Apply to view the changes now. |
|
13.
|
If you want to save the changes, click the Options button again. |
|
14.
|
On the Input Controls dialog, click Save. The Save Values dialog box appears. |
|
15.
|
Enter a descriptive name for the saved values and click Save. |
|
16.
|
Click OK on the Input Controls dialog. |
Note: When you open the Input Controls dialog for this report again, a list box at the top of the dialog displays all the saved input control versions, which you can click to view.
In the repository, you can view the formatted report with its custom set of input controls in the repository. The report has an arrow beside it, which you can click to show a list of the saved input controls you set up for the report.
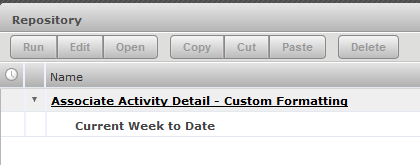
Click the name of the input control below the report to run the report with this filter. To add other report versions with different filters, click the main report, and then follow the above procedure from step 10. In the repository's Saved Reports folder, you can click the names of any of the saved input controls that appear in the list below the main report.
Note: XRA applies any formatting changes in a report to all versions of the report. If you want to save different versions of a report with customized formatting, you must first save a copy of the report, edit the format, and then add in the input control versions.
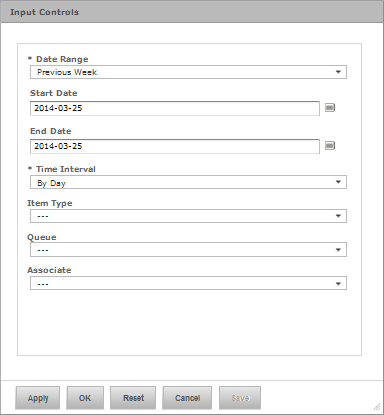
Changing and Saving Report Input Controls
To filter the data that appears in a report, you can change the various input controls for a report. For example, you can change the date range, time interval, item type, queue, associate name, or status.
To learn how to save both formatting and input control changes in a report, see Saving a Report. Use the following procedure if you just want to change and save report input controls.
To change and save report inputs
|
1.
|
Run a report to open it in the report viewer. |
|
2.
|
Move your pointer over the Save button, and then click the Save As option. |
|
3.
|
In the Save As dialog box, enter a unique name and an optional description in the Name and Description fields. |
Note: To avoid overwriting a report with the same name, save your updated reports with a different name than the default name.
|
4.
|
Below the Description box, select the folder to save the report in. The default location is Saved Reports. |
|
5.
|
Click Save to create a copy of the report. |
|
6.
|
On the XRA menu ba, click View > Repository. |
|
7.
|
In the Saved Reports folder, click the saved report to run it and display its data in the report viewer. |
|
8.
|
Click the Options button on the report toolbar. The Input Controls dialog box appears. |
|
9.
|
Change any of the input-control values in the dialog's fields. |
|
10.
|
If you want to view the results without closing the dialog box, click Apply. Alternatively, click OK to close the dialog box and display the filtered report. To restore the previous field settings, click Reset. |
|
11.
|
If you want to save the changes, click the Options button again |
|
12.
|
On the Input Controls dialog, click Save. The Save Values dialog box appears. |
|
13.
|
Enter a name for the saved values and click Save. |
|
14.
|
Click OK on the Input Controls dialog. |
Note: When you open the Input Controls dialog for this report again, a list box at the top of the dialog displays all the saved input control versions, which you can click to view.
In the repository, you can view the formatted report with its custom set of input controls in the repository.
Exporting a Report
After you open a report, you can export the report in different file formats.
To export a report
|
1.
|
Run a report to open it in the report viewer. |
|
2.
|
Move your pointer over the Export button, and then select the file format in which you want to export the file. |
XRA generates the file format. File formats include PDF, Word, Excel, and Open Document (ODT, ODS).
|
3.
|
Depending on which format you selected, the file may open immediately, or you may be given an option to open or save the file. |