Getting Started
IMPORTANT: Not all tasks documented in this guide are available for all user roles. If the guide documents a feature and you can not do the tasks because a menu option or other user interface elements is not displayed on your screen, your assigned role is not authorized to do the task.
The page that displays after you log in depends on whether you logged in as a user or an administrator.
To learn more about the XRA menu bar that appears on every page, see the XRA Menu Bar.
Logged In as a User
After logging in as a user, you see the Today's Inventory Activity Dashboard. It contains the Inventory Overview line chart, which shows you the latest trends for active, created, and resolved work items. Moving your pointer along any of the chart's lines reveals markers that display a pop-up box of the total number of active, created, and resolved work items for that date and time.
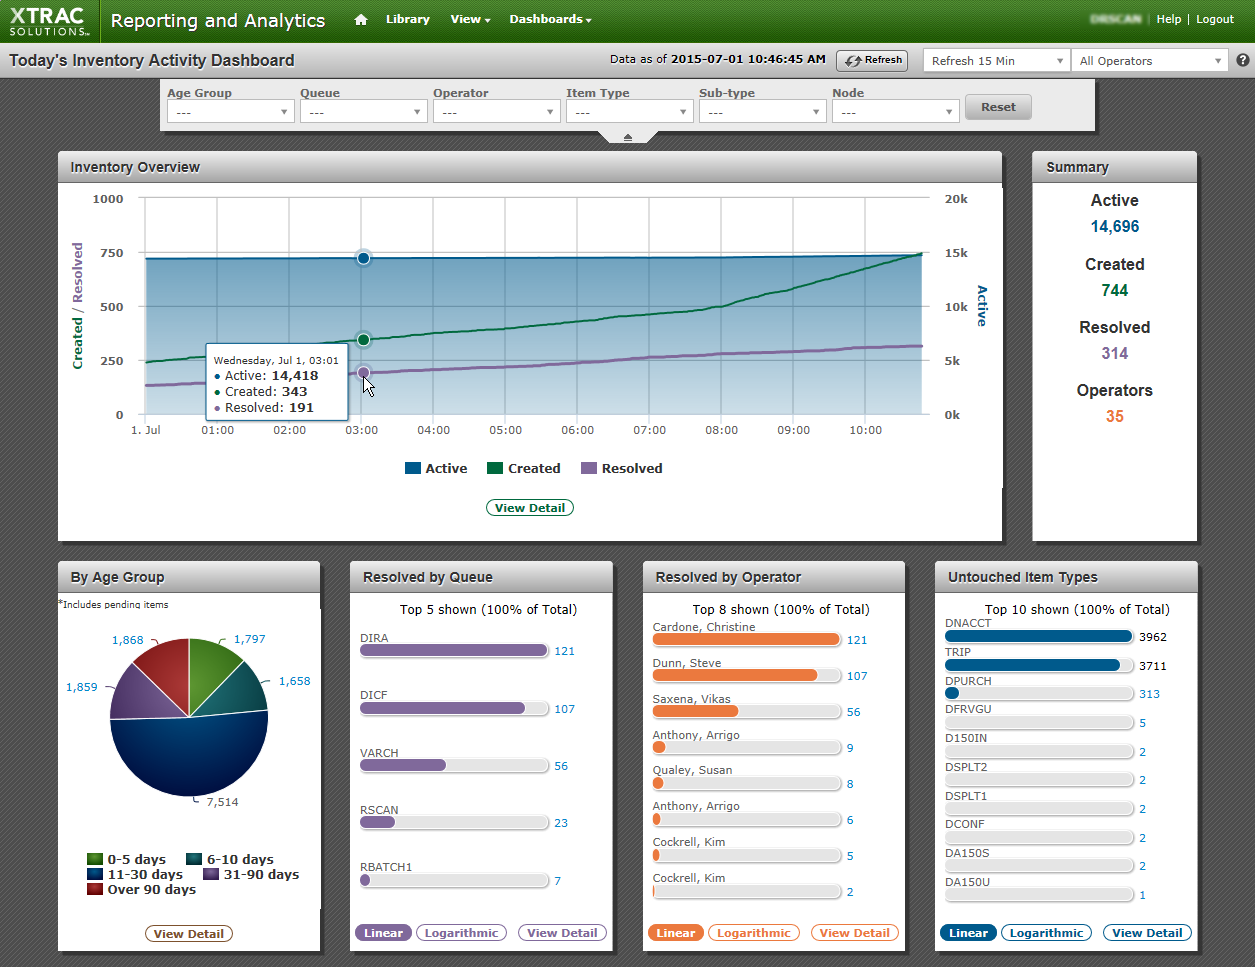
A Summary box beside the chart gives you totals for the active, created, or resolved work items as well as the number of operators.
A series of charts below the Inventory Overview chart display performance metrics. A pie chart shows you the work items segmented by age group. Horizontal bar charts display the totals for resolved items by the top queues, operators, and untouched item types. To learn more about dashboards, see Working with Dashboards.
You can use the filter section above the dashboard to change the default display of the metrics. See Filter Dashboard Data.
The XRA menu bar also contains options to view the user's home page, library, repository, and dashboards.
Logged In as an Administrator
After you log in as an administrator, your Home page displays shortcut icons to the most frequently used areas:
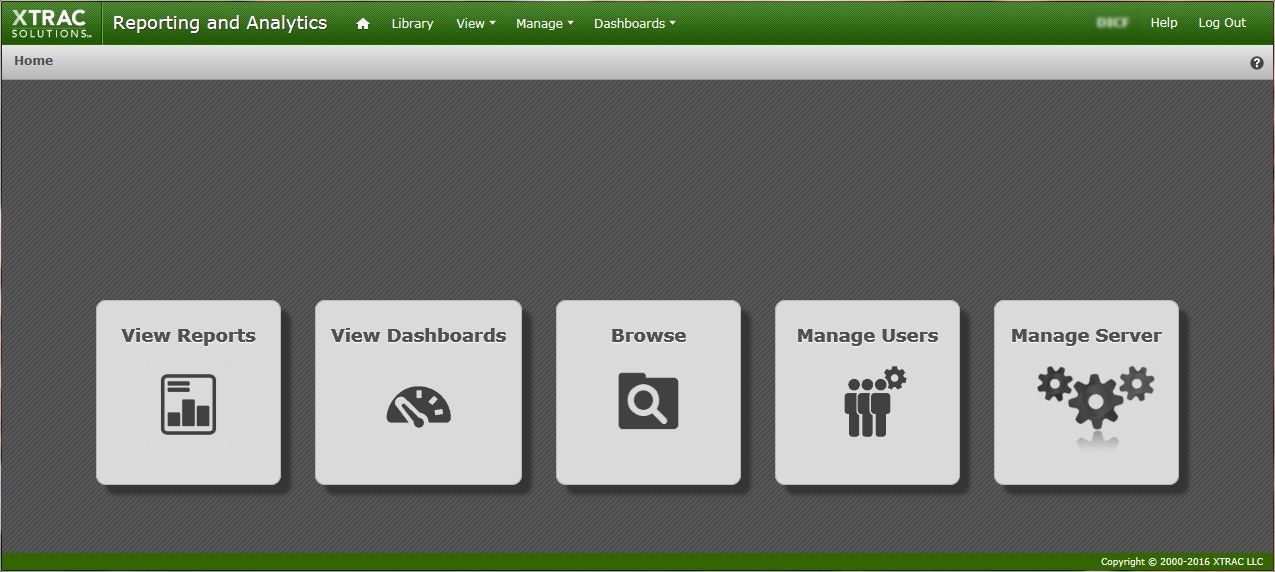
Click a shortcut icon on the administrator Home page to open the relevant area.
- View Reports
- View Dashboards
- Browse the repository
- Manage Users
- Manage Server Icon
These options are available on the XRA menu bar as well.
XRA Menu Bar
The following menu items display on the XRA menu bar, which appears on every page.

The following table lists the menu items, descriptions, and associated topics for the items on the XRA menu bar.
| Menu Items | Description | Topic |
|---|---|---|
| Home | Click this button to return to the administrator Home page if you are an administrator. If you are a general user, the default dashboard opens. | See above. |
| Library | Click this option to open the Search Repository pane, where you can filter and view reports and dashboards. | See Using the Library. |
| View |
Select View > Repository to open the Browse Repository pane, which displays the folders and their files in the repository. |
See Using the Repository. |
| Manage |
(Administrator-only menu item) Move your pointer over this menu item to select either the Users or Roles options. An administrator can manage users and roles on the Users pane and Roles pane. |
See Managing Users and Managing Roles. |
| Dashboards | Move your pointer over this menu item to select a dashboard from the list, or select All Dashboards to view a list of all the dashboards on the Search Repository pane. | See Working with Dashboards. |
| Username | Click the username link to display the User Details window that lists the USERID, the USER ROLES, and ORG associated to the user who is currently logged in. | |
| Help | Click this link to open the XTRAC Reporting and Analytics Guide. | See XTRAC Reporting & Analytics Guide |
| Log Out | Click this link to log out of the XTRAC Reporting and Analytics tool. | See Logging On and Logging Out. |